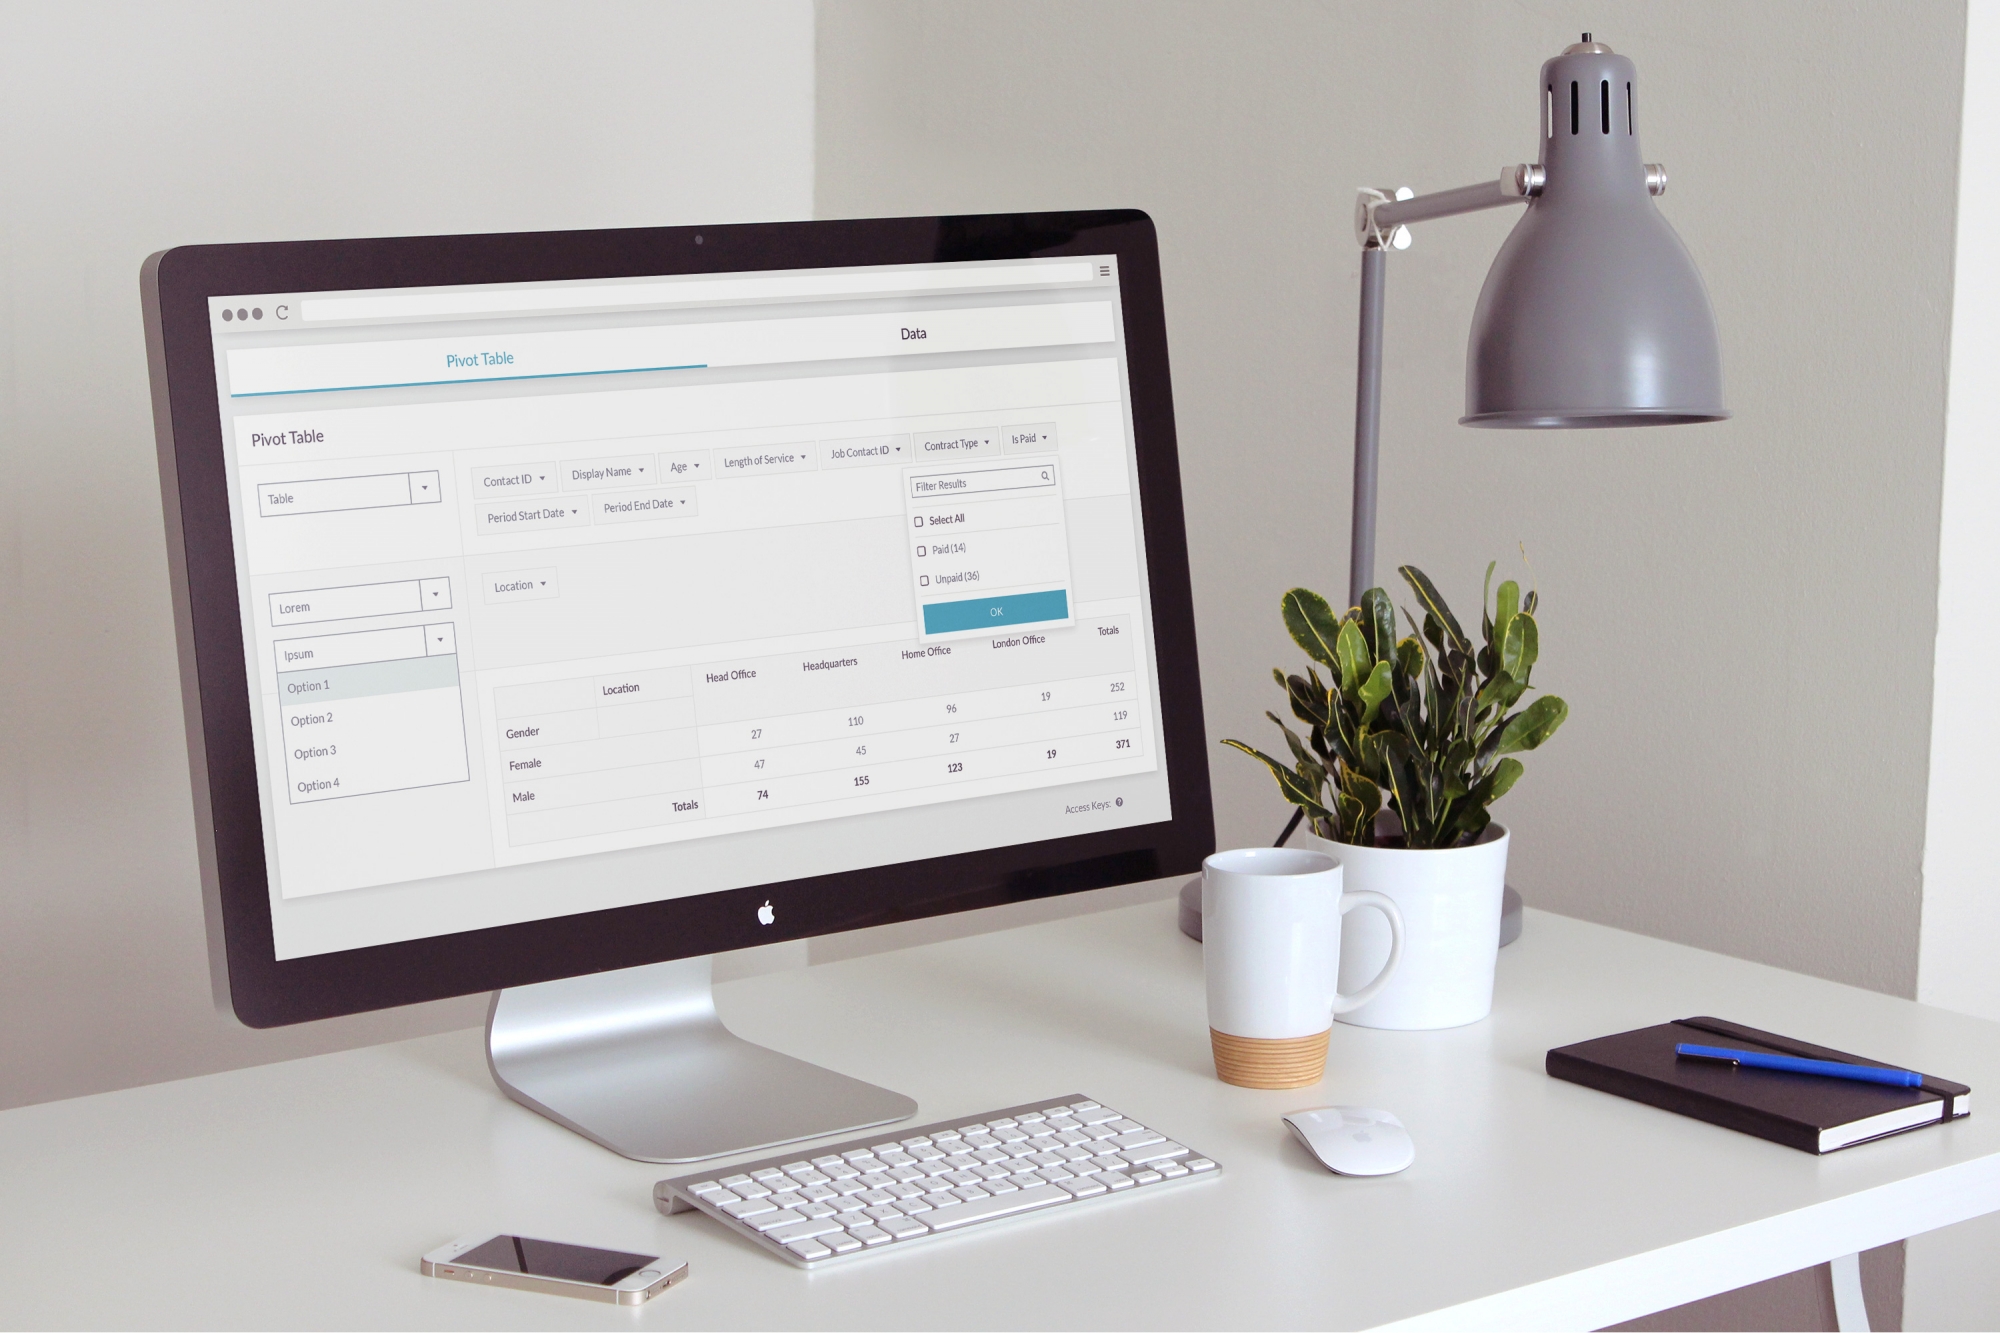
In September, we will be releasing a new version of reports that will completely change the way you see and understand analytics. And we can’t wait to show it to you!
We met with a number of UK charities to discover what kind of reports would make a difference in their work life. And we found a long wishlist, with time, resources, and tools being the main barriers in creating powerful reports.
HR managers were endlessly exporting their data into spreadsheets and spending hours creating the same reports over and over.
So, we sat together and we put our thinking caps on, to think of a flexible and comprehensive solution for our new reports release. Then we thought, why not integrate the pivot tables directly into the application! So that's what we did.
Pivot tables are one of the most powerful and flexible approaches to data processing available. The ability to group and aggregate data on nearly any field is vital to understanding your data. By incorporating this into CiviHR HR managers can access an almost endless amount of reports so that HR managers could get the insights they needed.
Reports 1.6 integrates perfectly with all the data available on CiviHR. No more exports, no more complicated reporting languages, just an easy to use, flexible system that bring your beautiful data to life.
But, enough talking. See below a sneak peak:
Gender by Department Report
Let’s start with a simple report, calculating the number of full time staff in your organisation. Add Department and maybe event Gender and voilà! Now you an exclusive view into how your workforce is split by gender.

Absence Type by Day of the Week Report
Want more visuals? You can quickly turn any pivot table into bar charts, tables, line graphs. Or one of our personal favourites, Heatmaps. It helps you instantly view patterns by looking at the hot or cool colours. Like sick day risk levels. Oh those Mondays...

We’d be happy to show you more, and get your input on this new tool!
Thinking box
By 2018, private and third sector organisations will have to submit a gender pay gap report. Planning early is key. Reports can help you gather that information for reflection, and even include visuals in your final submission.

