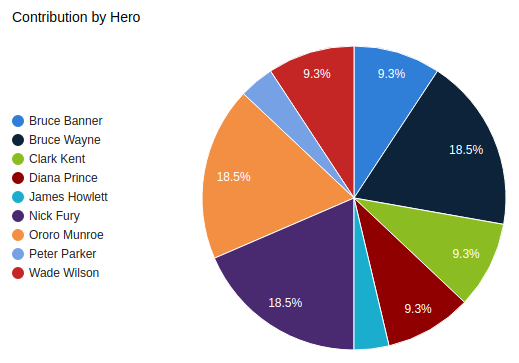
Reports are an incredibly powerful tool used to develop future forecasts, marketing plans, guide budget planning and improve decision-making. In CiviCRM, one of the most important applications for reporting is in tracking and assessing the various kinds of contributions.
Today we will take a look at how to create reports using CiviCRM data within views, a popular use-case for our clients at Skvare. We will then add a chart display using the Charts module for a contribution report to convert it from raw data into easy-to-understand, consumable information with views in Drupal 8. This will be ideal for presenting to constituents, board members, financial partners, and other stakeholders.
We will then create a block and place it directly on a relevant page, taking advantage of the ubiquitous block system to easily place our report anywhere we want on our website.
So let’s get started!
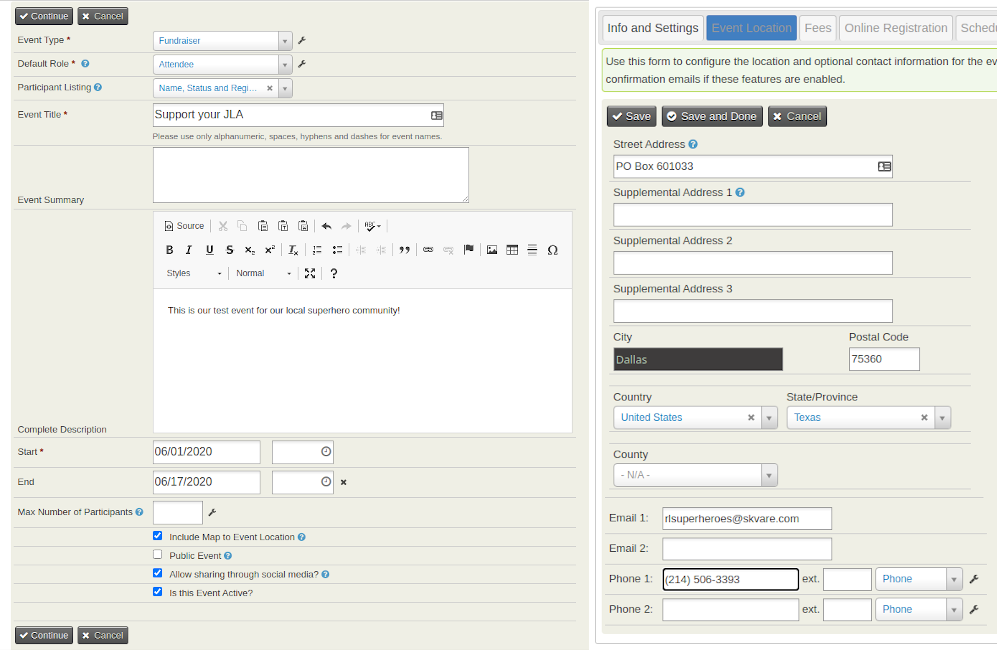
For our example, let’s say we’re holding an event for our “Support your JLA” initiative, and had our superhero contacts register for the event.
First, we’ll create our event and contribution options within CiviCRM.
We’ll need some dummy contribution data...
For this we’ll add few more superheroes to give some meat to our reports. And to stay within the scope of this example, I’ll quickly manually generate some contributions from our superhero contacts.
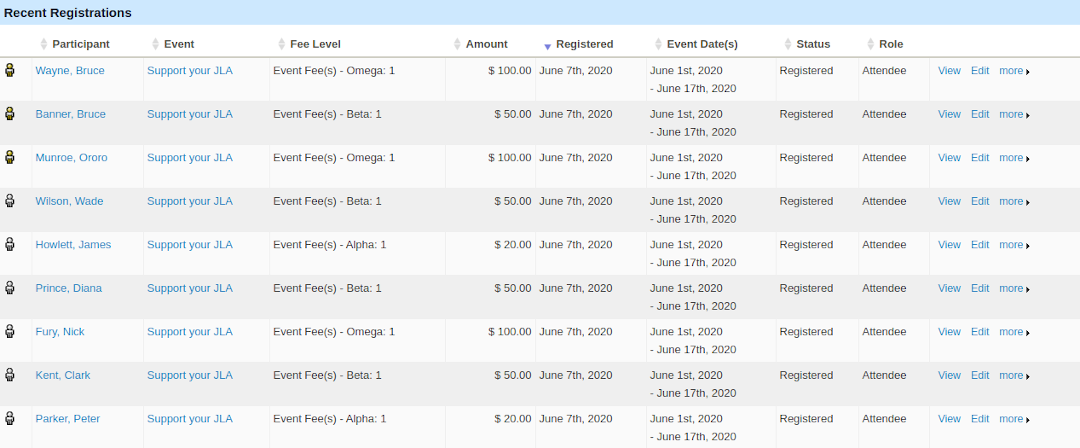
Side note: If you’re interested in learning more about how to set up events and registrations, let us know! We’d be happy to provide a free demo of these features.
Let’s integrate!
We’ll create our base view of “CiviCRM Contributions”, and start by adding;
- The necessary relationships for “Address” and “Participant”,
- The secondary relationship for “Contact” from “Participant”,
- And several fields of the Contribution and Contact we’d like to use.
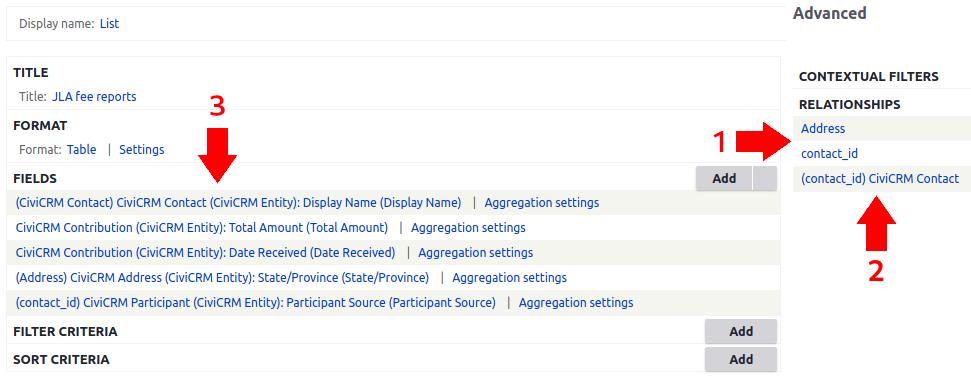
It’s recommended to first build your views display in a table. This allows you to organize your fields, and easily check and test your relationships, aggregations, and other settings to ensure they are set up correctly.
This is the output of our new CiviCRM Event view.

A picture is worth a thousand words
We also want to set up charts to render digestible visualizations of our data. We’ll begin by duplicating our view table display. Make sure you select “This page (override) and set the format to chart, and let’s select Chart Type “Pie”, “Display Name” as our label x-axis and “Total Amount” for our y-axis.
We will actually be setting this up as a pie chart, but for the other chart types these definitions will be accurate when displayed.
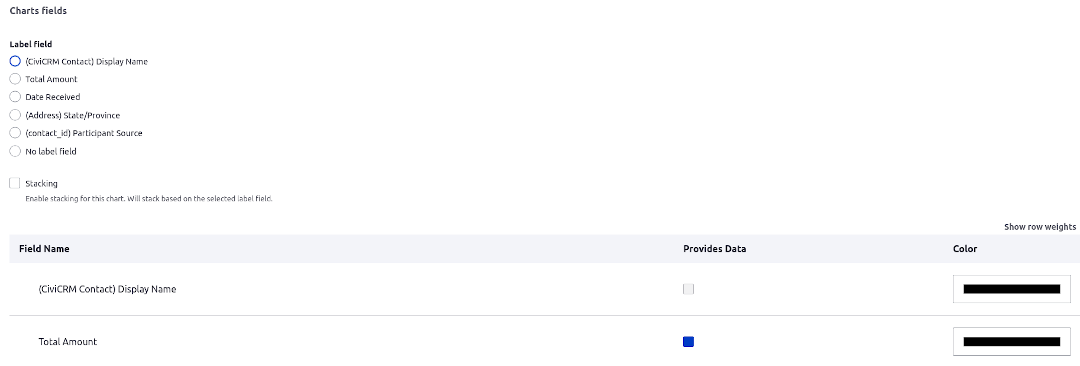
Then, if we set everything up correctly, we have our first visual chart of contributions for our CiviCRM event.
Anywhere, everywhere, blocks are your friends!
Lastly, we’ll duplicate our chart as a block and add it to the map page we made in our last blog! Remember to tweak your settings depending on where you want to display your view.
Reports and charts can be generated for anything using the CiviCRM Entity module.
With different combinations and settings, you can display anything from comparisons of monthly contributions or price sets, to participant locations, contact types, genders, or any other combination of fields and reported values.
Or you can display reports for active, expiring or expired membership records tracked over several years, or for specific activities or mailing reports.
If you have a specific use case you’d like to discuss, please contact our expert team here at Skvare for a free consultation. We’d love to speak with you!
Up next!
Our next blog topic will be on customizing event pages with the Drupal 8 Core Media module. Expanding and enriching CiviCRM with Drupal features is what makes the CiviCRM Entity module so powerful, and making use of the new media library is no exception!
For more information, you can read our CiviCRM Entity information page or visit the module homepage to review and install!
Quick links
Original blog: Contributions and Reports within Views
> Previous: Interactive Maps with CiviCRM Addresses
> Next: Customizing Event Pages with Media


