Hi,
I am Siddharth Gupta, and this post is an update from my last post about civisualize and a small summary of my last three months as a Google Summer of Code student for CiviCRM.
To start with, I would first like to thank all the mentors, Xavier, Gordon and Max. Your help and support over the last three months was indispensable. I really am proud of the fact that I could contribute something to the open-source community in the form of small contributions to dc.js and CiviCRM.
Google Summer of Code happened to me like a long dramatic story, to cut the story short, I was one of the admins of byld - software development club at my institute and few of the club members who were associated to GSoc as a mentor and student organized this talk telling all of us about Google Summer of Code. After the list of organizations were released, I started looking for an organization and luckily CiviCRM was the first organization I came across, mainly because of filter tags, CMSs and PHP. I got in touch with Xavier, wrote my proposal over a photography trip with friends, and now one thing I am very sure of is the fact that last three months were absolutely crazy. The amount of learning you get from something like open-source development is much more than what any school teaches in any graduate course.
Civisualize, a ready to use data visualization framework, is a solution to all the problems you face with thousands of entries in your CiviCRM. The problem is the larger the number of entries you have, the harder it is to find any information. Civisualize helps you visualize this data with some pre-made visualizations and provides a framework to create more such visualizations for yourself. Believe me when I say this, creating visualizations is really easy and fun.
To explain a bit more about civisualize, it uses the power of dc.js to create graphs that can help you filter through data just with few clicks. This allow users to understand the trends which are followed by the data in civiCRM. As a part of my GSoC, I tried creating few general visualizations for donations, events, contacts, donors, etc. These visualizations can be directly used by enabling the extension.
The list of available visualizations is available at yoursite.org/civicrm/dataviz. Some of the currently available visualizations include
-
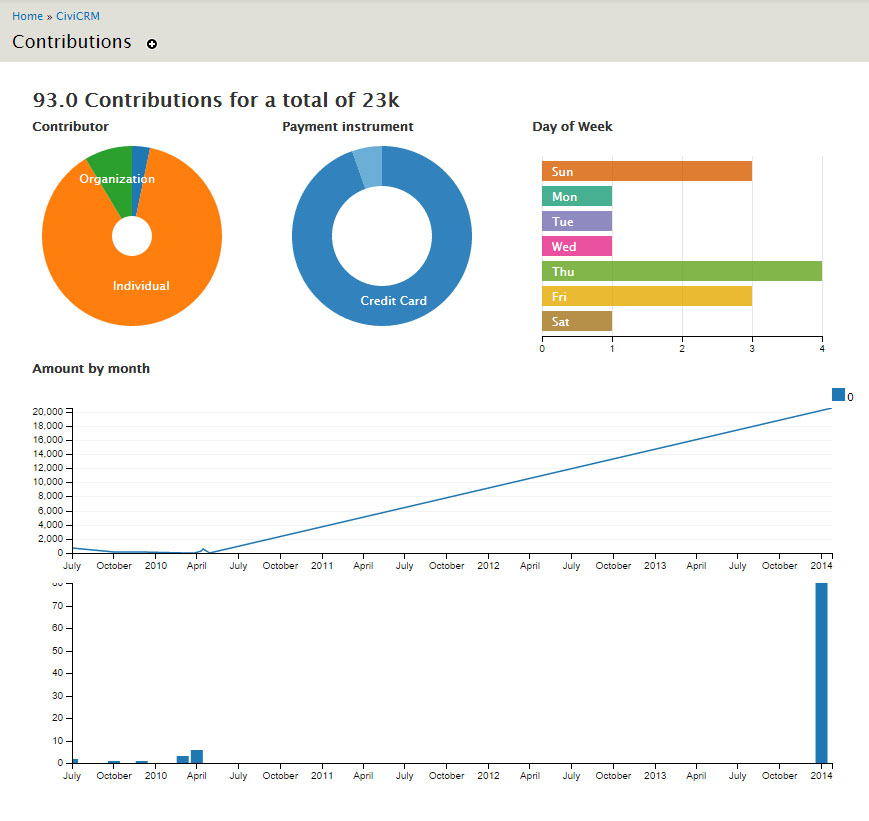
Contributions (/dataviz/contribute)
This provides an overview of contributions, type of contributors, the day of week the contribution was made, payment instrument, etc.
-
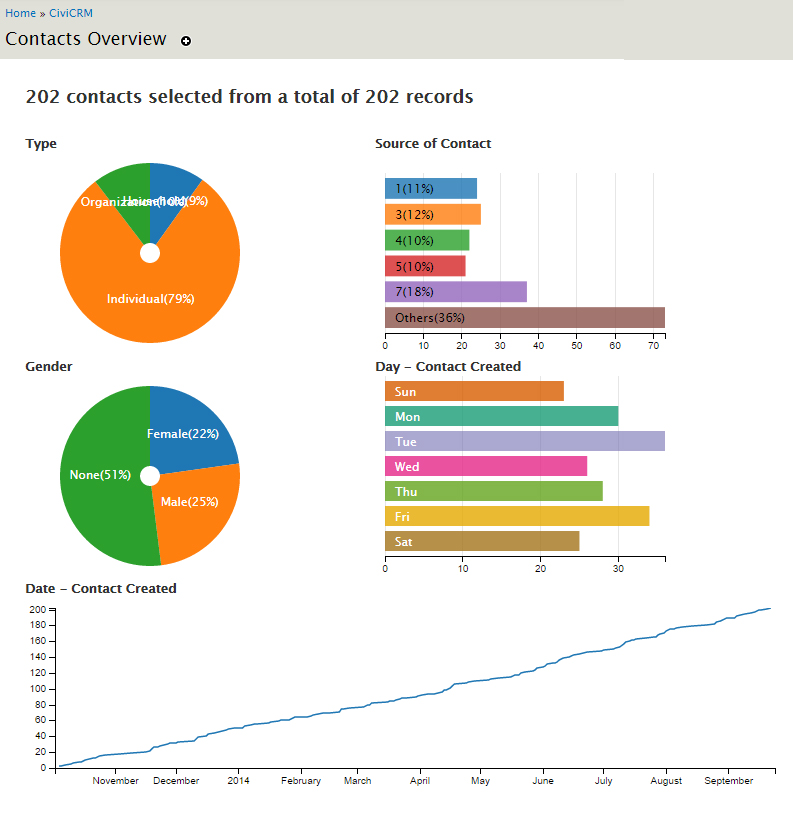
Contacts (/dataviz/contacts)
Contacts overview is a compilation of graphs showing types, gender, age, source of contact, contacts over the time etc.
-
Events (/dataviz/events)
Events shows a lot of information about all the events of an organization and their participants. It shows events over time, participants over time, money generated from events, type of events, etc. It also displays a table listing all the events.
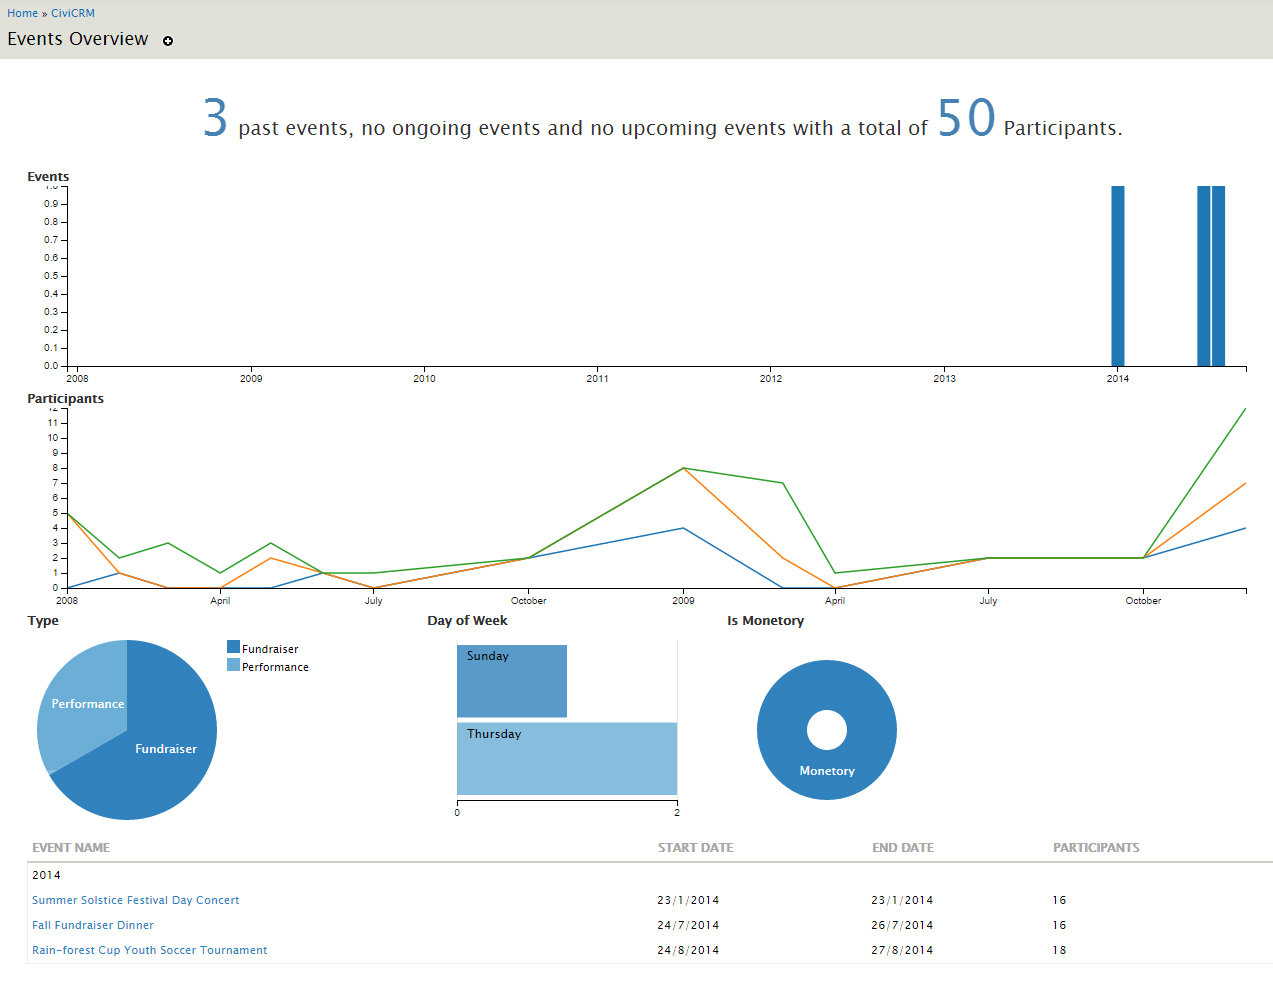
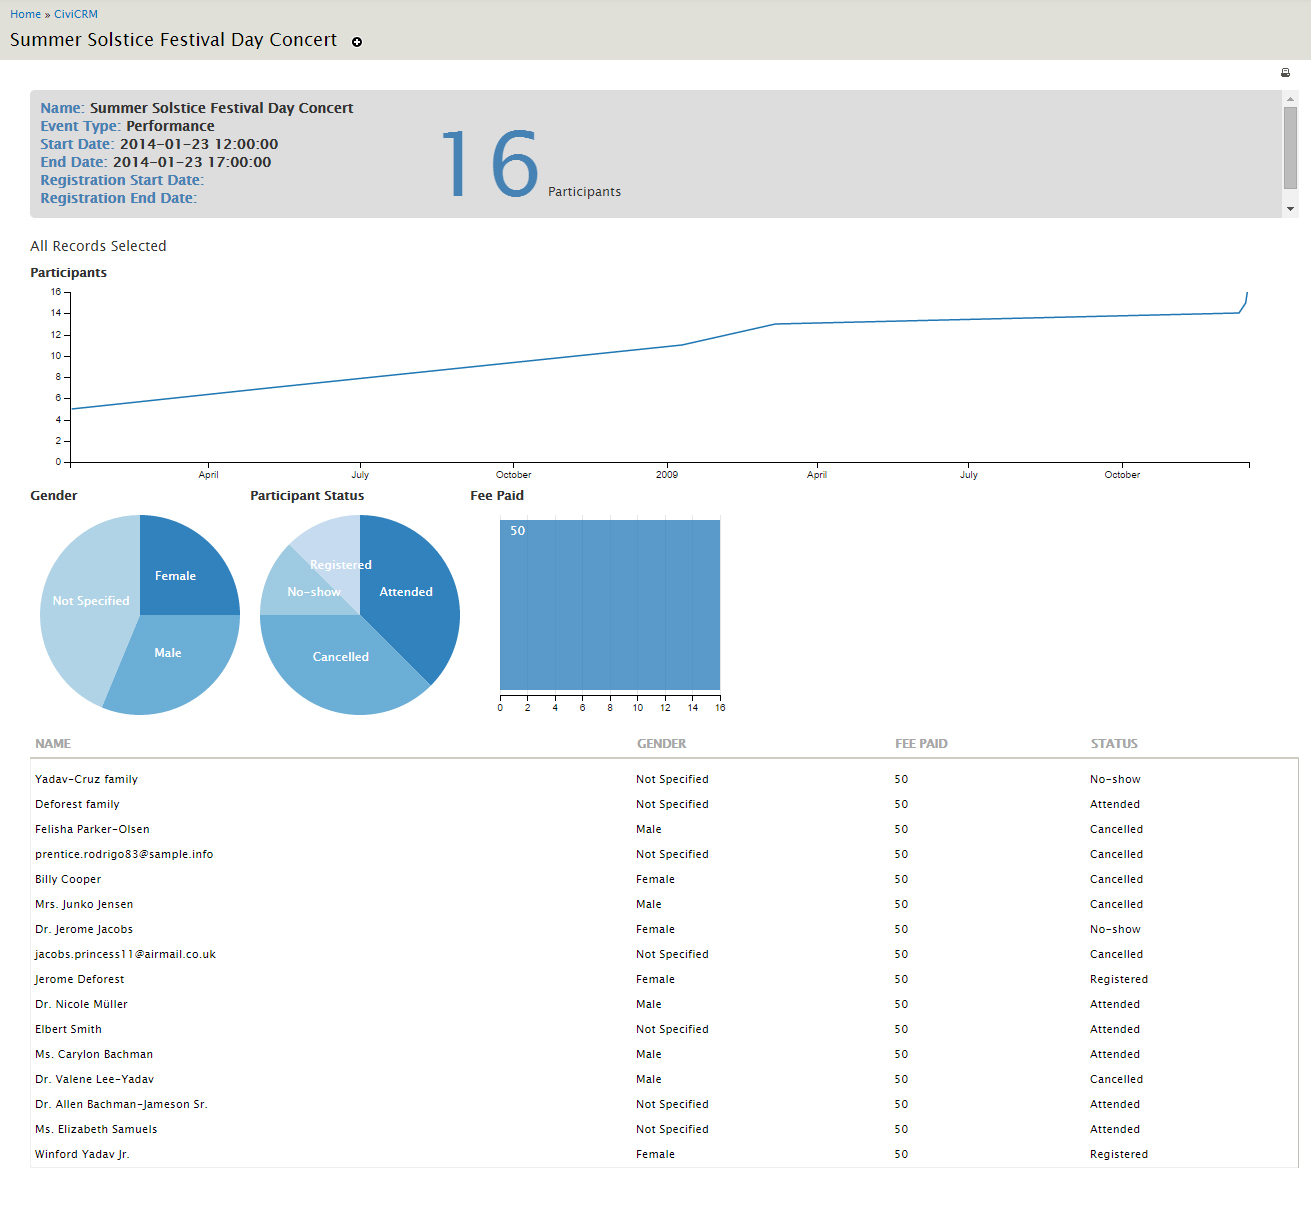
This table further links to specific event overview (/dataviz/event/) showing participants, their status, their fee etc.
-
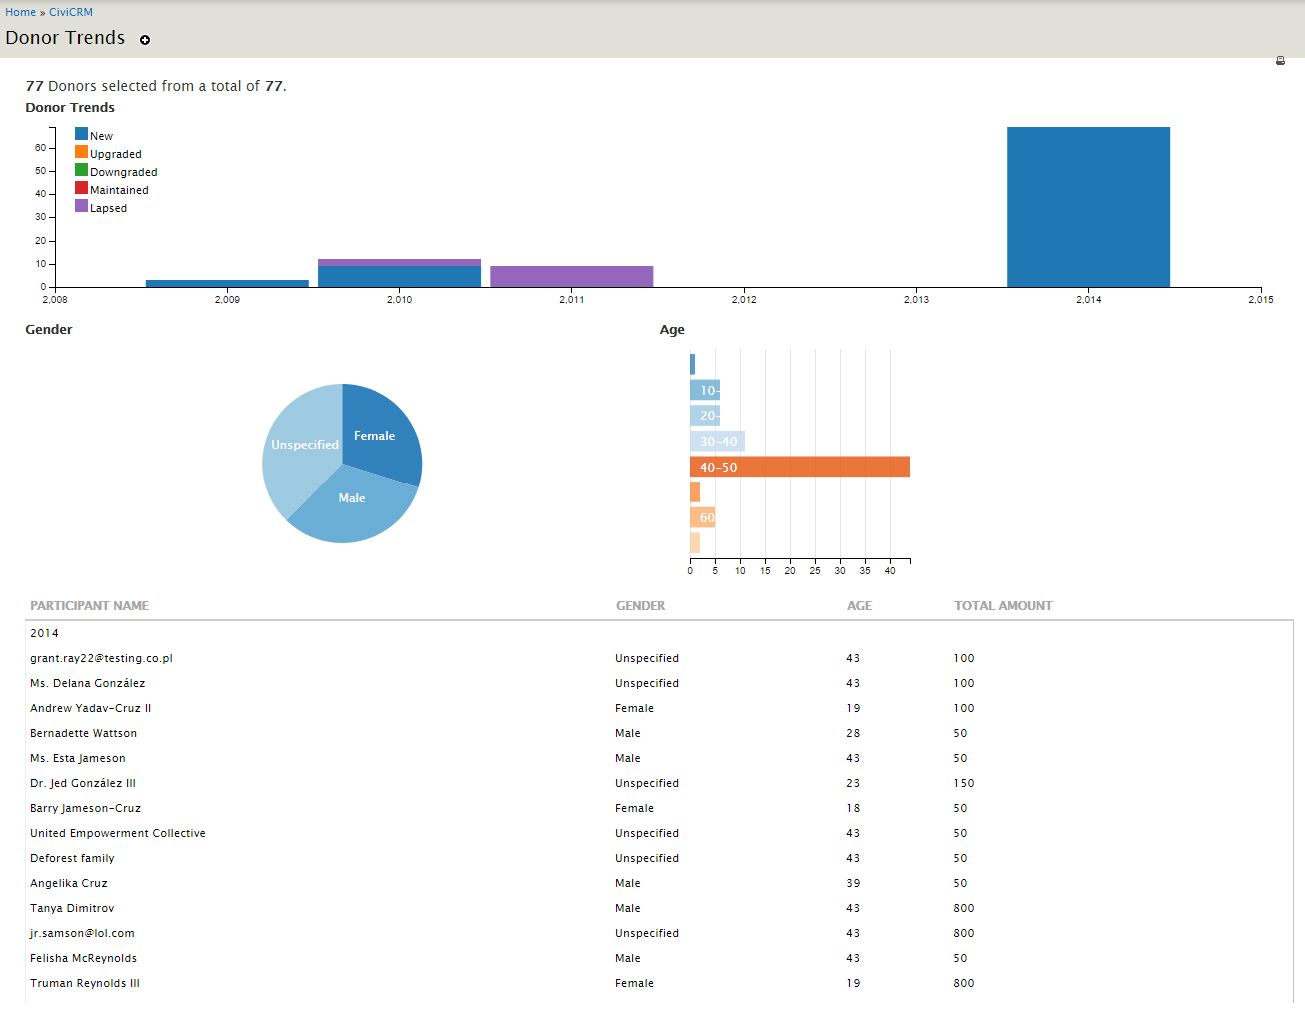
Donor Trends (/dataviz/donortrends)
Based on the idea of CiviCRM Donor Trends Extension, the donor trends overview showcases a Bar Chart with new, lapsed, upgraded, downgraded and maintained donors over the years. This further showcases the gender and age of the donors and a list of all the donors.
Need not be mentioned, you can add more graphs and details to the above mentioned visualizations.
Instructions for creating visualizations can be found here. You can further email me or go to the github for any feedback/suggestion. It will be really appriciated.
Further, the following links can help you in understanding data visualization in a better way.
Comments
THanks SId for all your work.
I'm happy to report that civisualize is now added to the extension directory. Please try and enjoy
https://civicrm.org/extensions/civisualize
Under Wordpress use URL : yoursite.org/wp-admin/admin.php?page=CiviCRM&q=civicrm/dataviz/
From: http://forum.civicrm.org/index.php/topic,34291.0.html
Hi,
X+ assisted recently to install civisualize. I must say it looks good. We had an issue today with 'configure dashboard dashlets' area. After closing a dashlet by simply clicking on the "x", the civisualize dashlet disappears. Is there a way to maake it available on the dashboard so that users can select it? Many thanks